Wallboards App
Real-time performance information for call center agents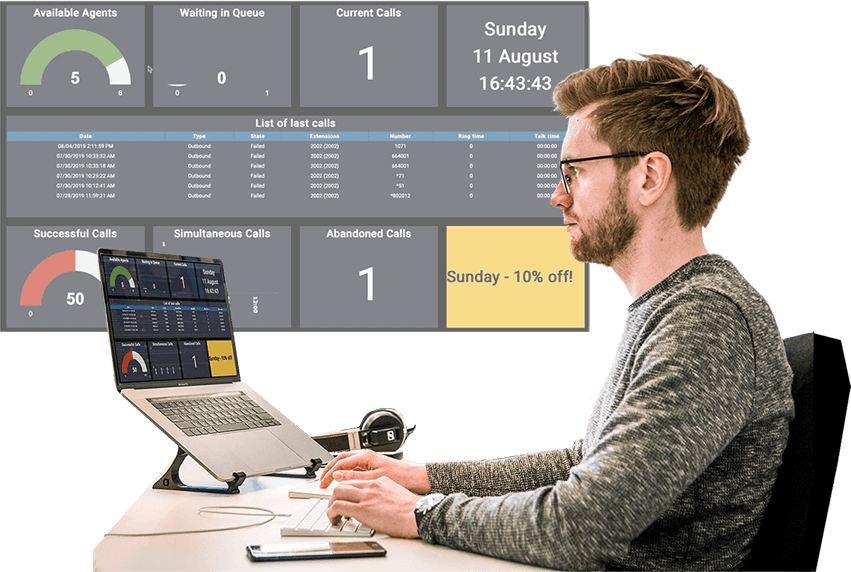

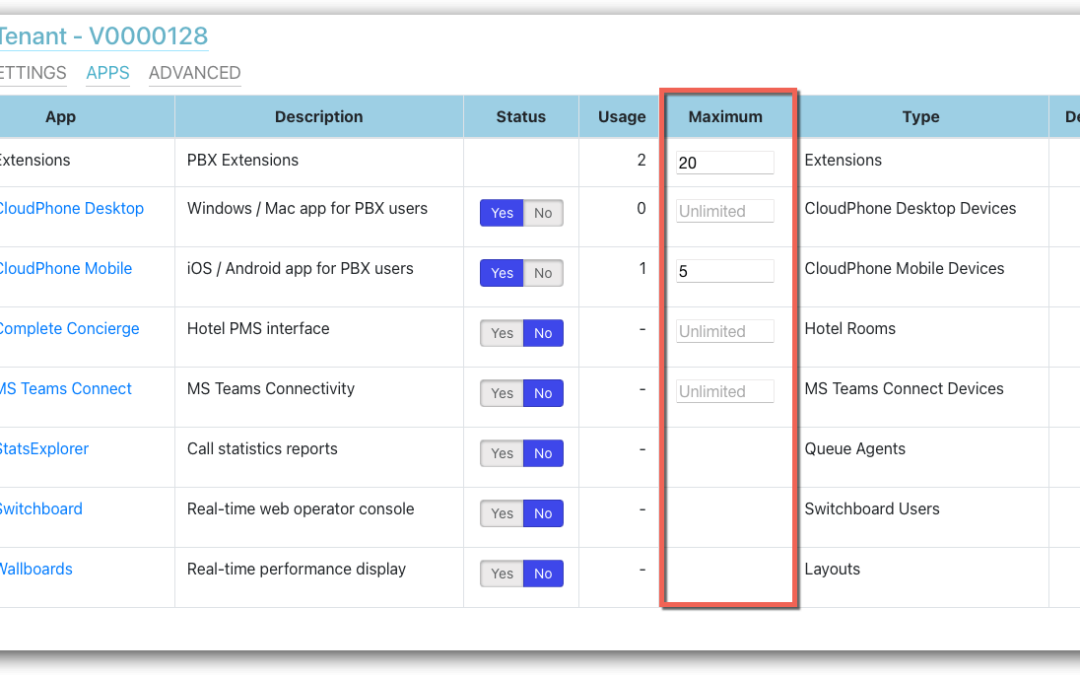
Wallboards
Real-time performance display
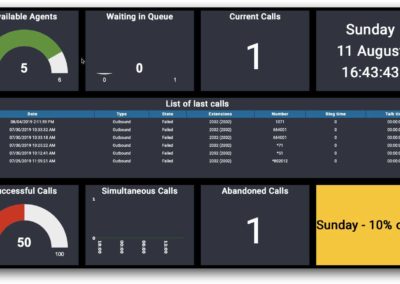
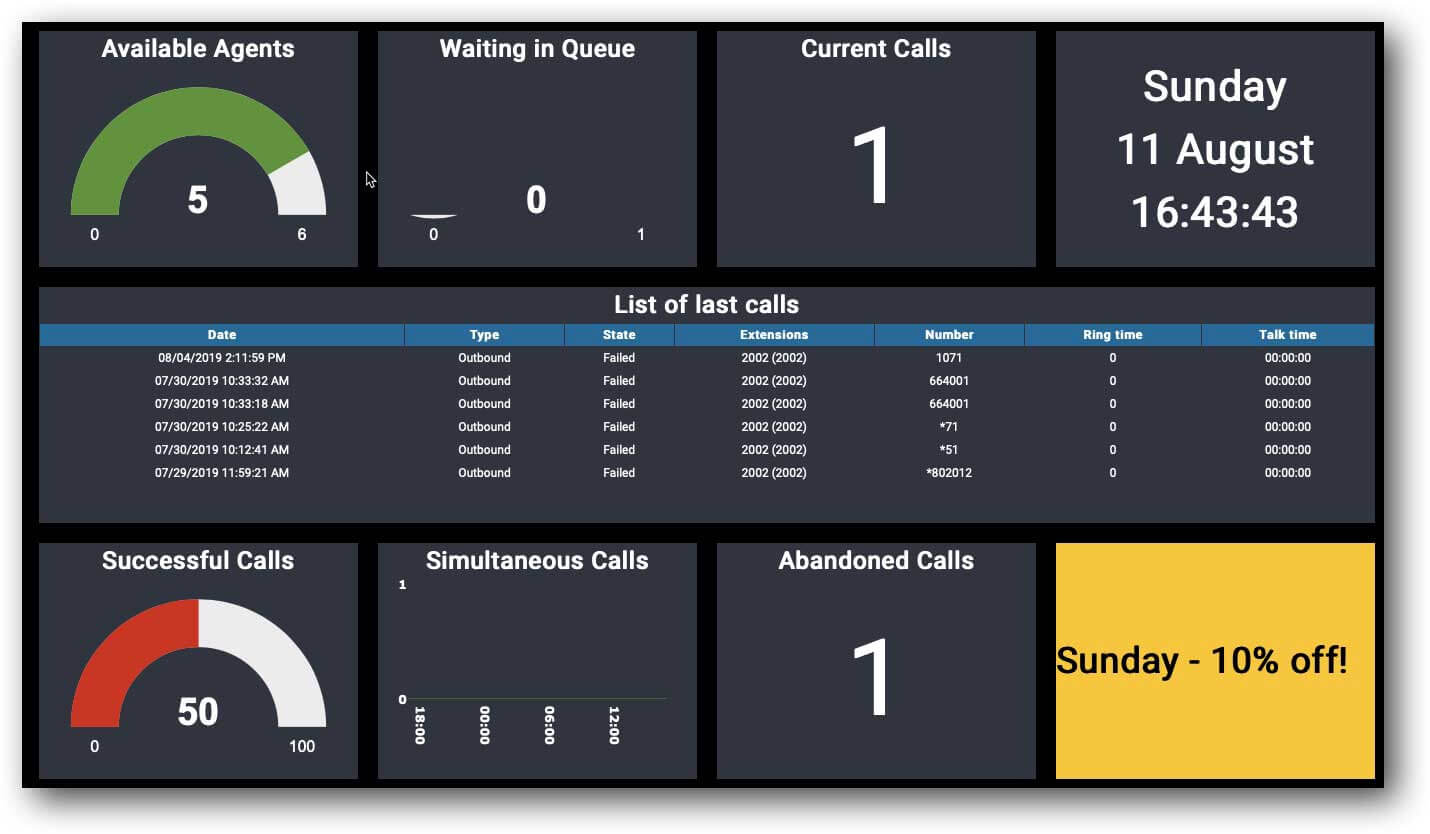
Get real-time performance information for call center agents. Set up customized wallboards and dashboards using an easy-to-use interface.
Monitor SLA, free agents, callers in queue, agent status, system load and many more parameters with a clear visual representation that helps improve performance in real-time.
License type: Layouts Developed by: IP-Connect
Performance wallboard is a StatExplorer plugin helping call center’s supervisor to boost their team performance, reduce queue wait time, and increase customer satisfaction.
Performance has been built to be displayed in a large screen but can also be used on a smaller screen to get instantaneous and real-time information.

Widgets available:
- Available (idle) agents count
- Available memory (MB)
- Call repartition by account code (Top 10)
- Call repartition by DID (Top 10)
- Call repartition by number (Top 10)
- Call type repartition
- Connected agents count
- CPU Usage (graph)
- CPU Usage (text)
- Current call count
- Currently waiting call count in a queue
- Date and time
- Extension status
- List of last calls (table)
- Performance of a queue (% of successful call)
- Post ‘it
- Queue agents (tables)
- Queue call repartition
- Queue wait average
- Session and pause durations per agent (table)
- Simultaneous call graph
- Successful or abandoned call count in a queue
- Web page
Monitor SLA, free agents, callers in queue, agent status, system load and many more parameters with a clear visual representation that helps improve performance in real-time.

